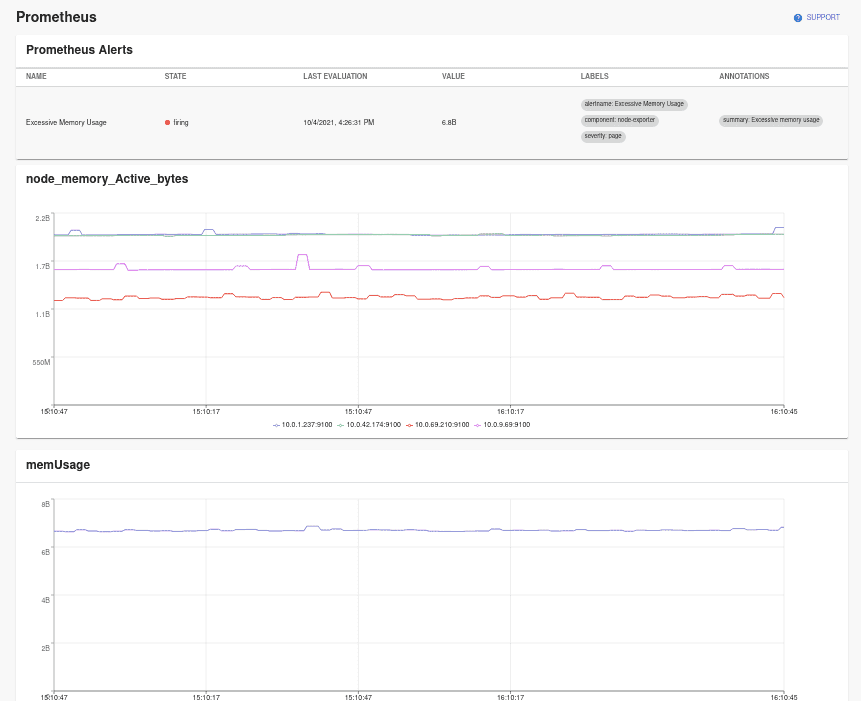
See the Prometheus Backstage plugin in action
Request a Roadie demoInstallation steps
The Prometheus plugin is a frontend plugin. You will need to install it, configure it and add it to an appropriate location on the entity page.
Install the Prometheus plugin into Backstage from the app folder of your repository.
cd packages/app
yarn add @roadiehq/backstage-plugin-prometheus
Setup a new proxy endpoint for the Prometheus API. Prometheus is unsecured by default but if you are running it behind a reverse proxy or other authentication mechanism, this proxy configuration can be used to define authentication method to use.
# app-config.yaml
proxy:
  '/prometheus/api':
    # url to the api and path of your hosted prometheus instance
    target: http://localhost:9090/api/v1/
    headers:
      Authorization: ${YOUR_AUTH_TOKEN_IF_PROMETHEUS_IS_SECURED}
(Optional) Additionally you can set up a different proxy path to be used by defining prometheus.proxyPath configuration
# Defaults to /prometheus/api/ and can be omitted if proxy is configured for that url
prometheus:
  proxyPath: /prometheus/api
The Backstage Prometheus plugin both entity content component and widget components.
Content Page Setup
// packages/app/src/components/catalog/EntityPage.tsx
import {
  EntityPrometheusContent,
} from '@roadiehq/backstage-plugin-prometheus';
...
const serviceEntityPage = (
  <EntityLayout>
    ...
    <EntityLayout.Route path="/prometheus" title="Prometheus">
      <EntityPrometheusContent />
    </EntityLayout.Route>
    ...
  </EntityLayout>
);
Widgets Setup
// packages/app/src/components/catalog/EntityPage.tsx
import {
  EntityPrometheusAlertCard,
  EntityPrometheusGraphCard,
} from '@roadiehq/backstage-plugin-prometheus';
...
const overviewContent = (
  <Grid container spacing={3}>
    ...
    <Grid item md={8}>
      <EntityPrometheusAlertCard />
    </Grid>
    <Grid item md={6}>
      <EntityPrometheusGraphCard />
    </Grid>
    ...
  </Grid>
);
Found a mistake? Update these instructions.
Things to know
Features
The Prometheus plugin is a frontend plugin that provides convenient access to frequently used Prometheus capabilities. Developers see pertinent information and actions for every entity that is connected to a Prometheus server.
The plugin provides an entity content page and two additional widgets:
- Alert table widget
- Prometheus Graph widget
- Graph widget has two versions, line graph and an area graph
Entity annotations
The plugin uses entity annotations to determine what data to display. There are two different annotations that can be used:
- Rule annotation to visualize Prometheus recording rules and queries
- Alert annotation to display Prometheus alerting rule in a table format.
Graphs
prometheus.io/rule
The ‘rule’ annotation expects a comma separated list of queries or recording rules and grouping dimension tuples. Dimension is optional and can be omitted which leads to the first label found from the returned data set to be used as the key to group items with.
The annotation supports individual metrics, promQL queries or references to a name of a recording rule. For complex queries a recording rule is the preferred option, since annotation parsing prevents the usage of characters , and | in queries.
Example annotation:
prometheus.io/rule: memUsage|component,node_memory_active_bytes|instance,sum by (instance) (node_cpu_seconds_total)
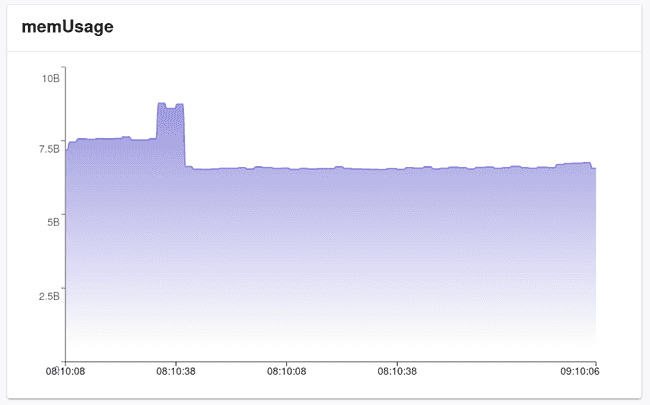
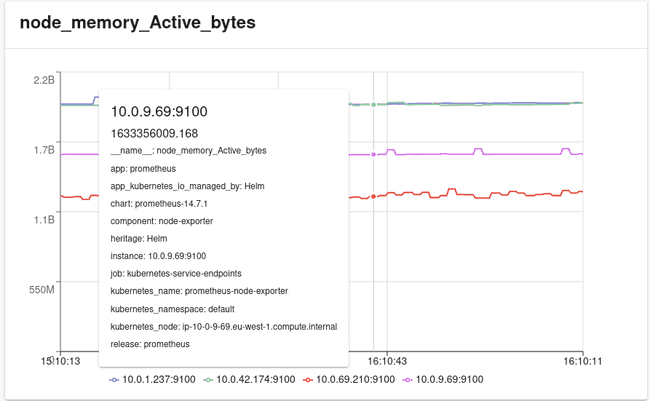
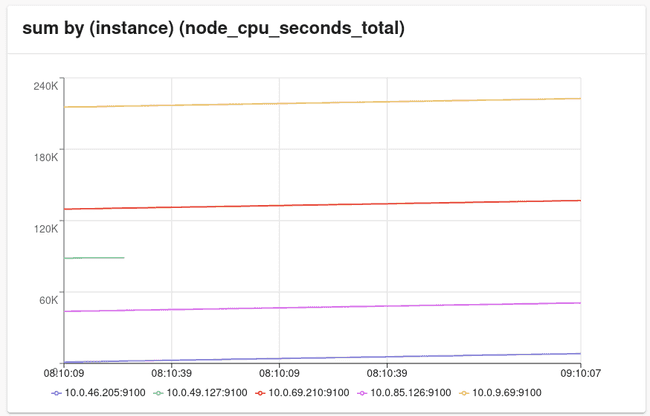
Produces the following graphs:
-
memUsage|component(grouping by component, otherwise__name__would be the first item on this saved rule. Showed here as an area graph)
-
node_memory_active_bytes|instance(grouping byinstance, image shows extra data on hover over a line.)
-
sum by (instance) (node_cpu_seconds_total)(instanceis the grouper label defined in the query —> it is returned on the result set as the first label name, and is therefore used to group data with.)
Alerts
prometheus.io/alert
The ‘alert’ annotation expects a comma separated list of predefined alert names from the Prometheus server. These are iterated and displayed in a table, displaying state, value, labels, evaluation time and annotations. To display all alerts configured in Prometheus a magic annotation prometheus.io/alert: all can be used.
Example annotation:
prometheus.io/alert: 'Excessive Memory Usage'
Custom Graphs and Tables
For more customisability the package exports both PrometheusGraph and PrometheusAlertStatus as individual components. It is possible to create more customized graphs and/or tables using these directly by dynamically constructing props that these component are expecting.
Type definition for PrometheusGraph props is:
{
   query: string;
   range ? : {
      hours? : number;
      minutes? : number;
   };
   step ? : number;
   dimension ? : string;
   graphType ? : 'line' | 'area';
}
Type definition for `PrometheusAlertStatus’ props is:
{
  alerts: string[] | 'all';
}
Prefer a no-code Backstage setup?
Request a Roadie demoBecome a Backstage expert
To get the latest news, deep dives into Backstage features, and a roundup of recent open-source action, sign up for Roadie's Backstage Weekly. See recent editions.

